Analyzing Scraped Data with Kubeflow Notebooks
This guide walks you through the Kernel-Planckster Tutorial Notebook. It aims to provide broader detail on how to view and analyze the scraped data obtained when running the kubeflow pipelines.
Step 1: First, connect to kernel-planckster:
kernel_planckster, protocol, file_repository = setup(
    job_id=job_id,
    logger=logger,
)
Step 2: Verify the existence of scraped data:
source_list = kernel_planckster.list_all_source_data()
There should exist an output that looks like the following:
[

{'created_at': '2024-04-14T23:59:19.083454',
  'updated_at': '2024-04-14T23:59:19.083457',
  'deleted': False,
  'deleted_at': None,
  'id': 1,
  'name': '2023_08_08__2023_08_09',
  'relative_path': 'sentinel/test/1/true_color/2023_08_08__2023_08_09.png',
  'type': 'png',
  'protocol': 's3',
  'status': 'available'
},

{
  "created_at": "2024-04-15T04:35:20.736662",
  "updated_at": "2024-04-15T04:35:20.736667",
  "deleted": false,
  "deleted_at": null,
  "id": 130,
  "name": "2023_August_23",
  "relative_path": "augmented/by_date/2023_August_23.json",
  "type": "json",
  "protocol": "s3",
  "status": "available"
},

{

...

}
Note the mix of scraped and augmented data that is pulled.
Step 3: Download all of the data sources deemed relevant to a local folder in the Kubeflow Notebook
work_dir = "./.tmp"
for source in source_list:
    download_source_if_relevant(source, job_id, tracer_id, scraped_data_repository, work_dir)
Where download_source_if_relevant is a function that calls:
signed_url = kernel_planckster.download_from_signed_url(source)
file_repository.public_download(signed_url=signed_url, file_path="./LOCAL_DIRECTORY/some_file_name.format")
Or, use the utility functions in scraped_data_repository.py that take care of file naming, formatting, and saving:
scraped_data_repository.download_img(source, job_id, path)scraped_data_repository.download_json(source, job_id, path)- etc.
Step 4: After saving all relevant data, perform the desired vizualizations:
Note: visualizations require having matched satellite and social media data. This type of augmentation is usually performed by an Augmentation Repository, but in case it has not, one can use the following code:
# load tweets (or any kind of scraped social media) data that is relevant to the particular usecase (wildfires/disaster)

twitter_df = pd.read_json(f'{work_dir}/twitter_augment/data.json', orient="index")
telegram_df = pd.read_json(f'{work_dir}/telegram_augment/data.json', orient="index")
sentinel_dir = os.path.join(work_dir, "wildfire_coords")

# load wildfire (or any kind of disaster) data
for wildifre_coords_json_file_path in os.listdir(sentinel_dir):
    data = []
    sentinel_df= pd.read_json(os.path.join(sentinel_dir,wildifre_coords_json_file_path), orient="index")
    for index, row in sentinel_df.iloc[0:].iterrows():
        lattitude = row['latitude']
        longitude = row['longitude']
        status = row['status']
                                                    #title tweet location
        data.append([status, lattitude, longitude, "n/a", "n/a", "n/a" ])


# perform matching of satellite image disaster dates with tweets
underscore_date=wildifre_coords_json_file_path[:wildifre_coords_json_file_path.index("__")]
    split_date = underscore_date.split("_")
    sat_image_year = split_date[0]; sat_image_month = key[split_date[1]]; sat_image_day = split_date[2]


    matches_found_twitter = 0
    for index, row in twitter_df.iloc[0:].iterrows():
        tweet_title = row['Title']
        tweet_tweet = row['Tweet']
        tweet_location = row['Extracted_Location']
        tweet_latitude = row['Resolved_Latitude']
        tweet_longitude = row['Resolved_Longitude']
        tweet_month = row['Month']
        tweet_day = row['Day']
        tweet_year = row['Year']
        tweet_disaster_type = row['Disaster_Type']

        # match satellite image dates with tweet dates
        if(int(sat_image_year) == int(tweet_year) and sat_image_month == tweet_month and int(sat_image_day) == int(tweet_day)):
            matches_found_twitter += 1
            # save the data
            data.append([f"tweet about {tweet_disaster_type}", tweet_latitude, tweet_longitude, tweet_title, tweet_tweet, tweet_location ])
Clearly, tweets that are relevant to a particular disaster and ouccur on the same day as disasters detected by sattelite images are matched and the locations of both types of data can be compared and analyzed.
Step 5: Analyze the output using leafmap:
- Load the true-color image from our sentinel dataset:
from pystac_client import Client

client = Client.open("https://planetarycomputer.microsoft.com/api/stac/v1")

search = client.search(
    max_items=10,
    collections=['sentinel-2-l2a'],
    bbox=[-156.708984, 20.759645, -156.299744, 20.955027],
    datetime="2023-08-08/2023-08-25",
)
items = search.item_collection()
for item in items:
    print(item.id)
- Create the interactive leafmap:
import leafmap.foliumap as leafmap #choose one of 6 plotting backends

m = leafmap.Map()
m.add_stac_layer(
    collection="sentinel-2-l2a",
    item = items[0].id, #choose the latest one to display
    assets=["B04", "B03", "B02"],
)
# load the map in jupyter:
m
- Overlay the augmented social media data and disaster events:
work_dir = './.tmp' # define your work directory here
bounding_box = (-156.708984,20.759645,-156.299744,20.955027) #set coords as well
import os
import pandas as pd
from folium.features import DivIcon
for file_path in os.listdir(os.path.join(work_dir, "by_date")):
if file_path.endswith('.json'): # check to ensure only json files are processed
df = pd.read_json(os.path.join(work_dir, "by_date", file_path), orient="index")
for index, row in df.iloc[0:].iterrows():
status = row['Status']
latitude = row['Lattitude']
longitude = row['Longitude']
title = row['Title']
text = row['Text']
icon_text=''
icon_size=''
if "tweet" in status:
icon_text='🐦' # Unicode for the bird emoji
icon_size=(100,100)
folium.Marker(
[latitude,longitude],
icon=DivIcon(
icon_size=icon_size,
icon_anchor=(0,0),
html='<div style="font-size: 12pt">%s</div>' % icon_text,
),
popup = text
).add_to(m)
elif "fire" in status: #wildfire
icon_text='🔥' # Unicode for fire emoji
icon_size=(30,30)
folium.Marker(
[latitude,longitude],
icon=DivIcon(
icon_size=icon_size,
icon_anchor=(0,0),
html='<div style="font-size: 12pt">%s</div>' % icon_text,
),
).add_to(m)
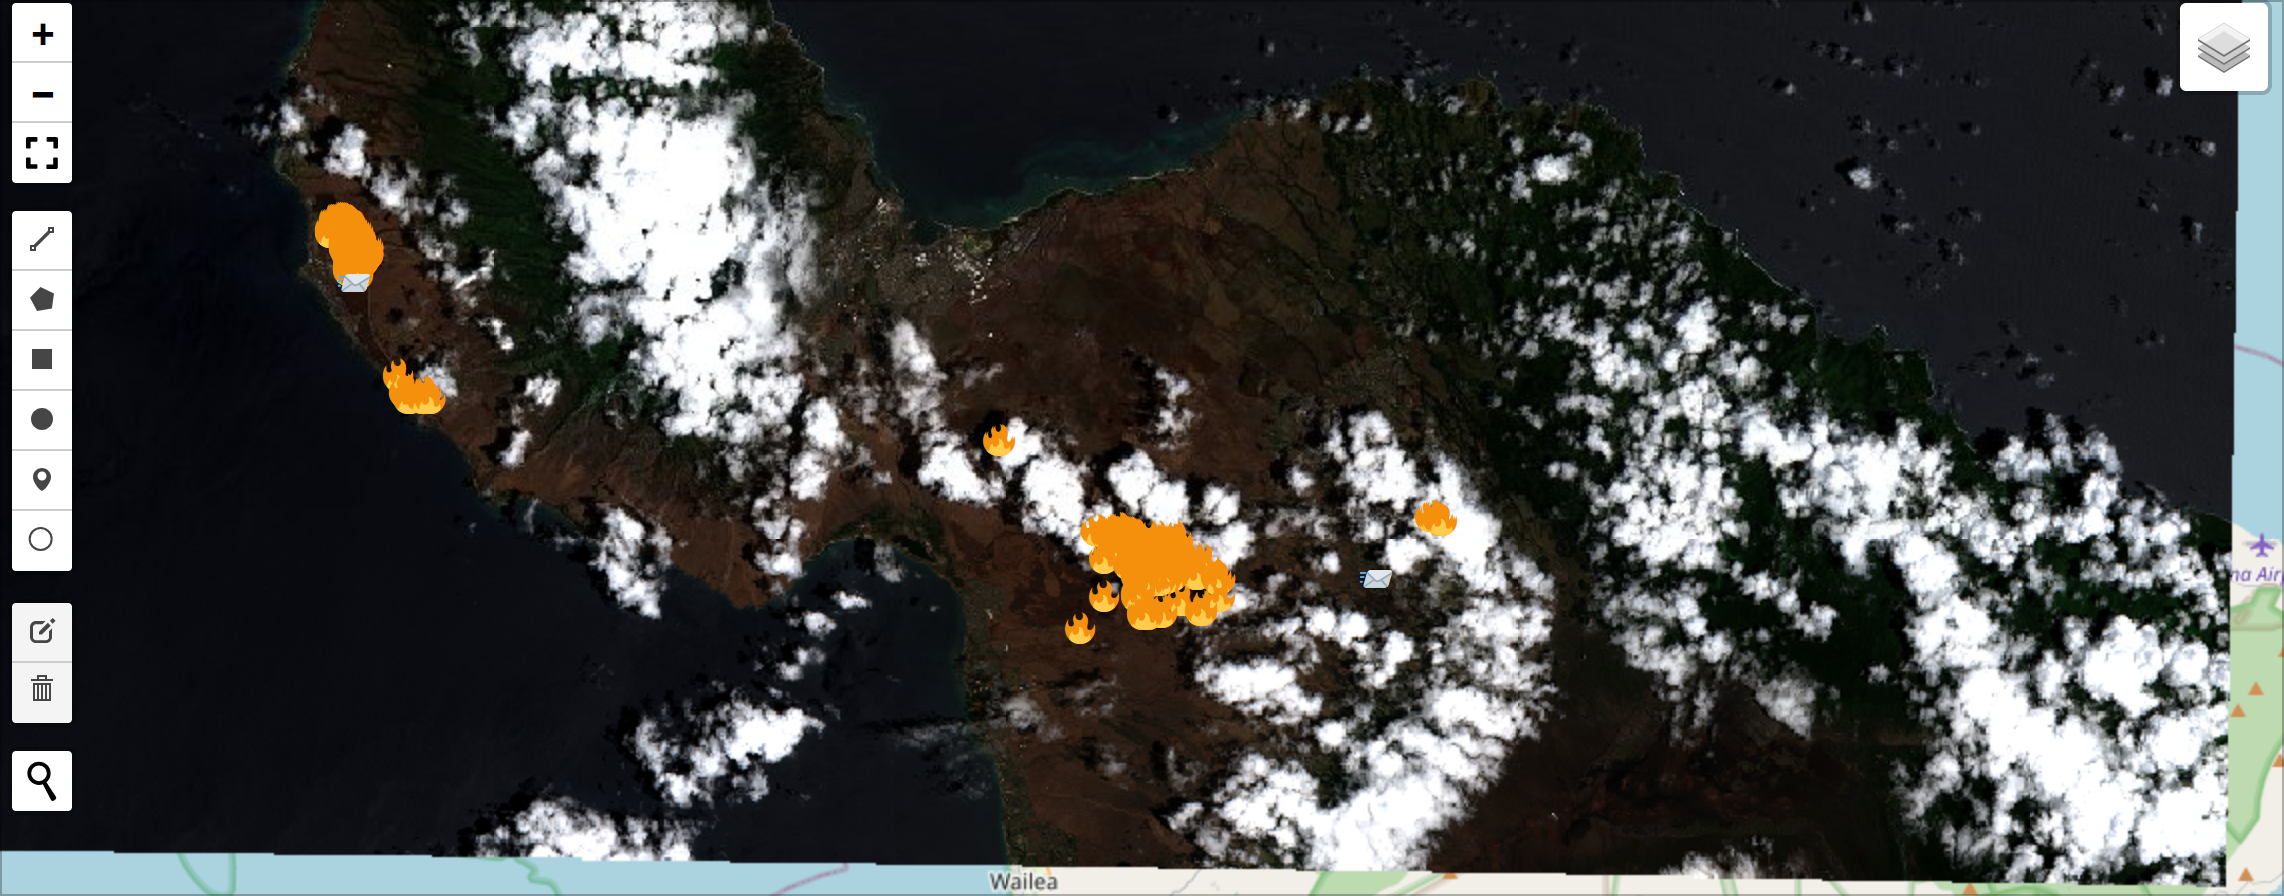
# render the final output:
m
The output should be interactive and have dynamic overlays: