Lieutenant Planckster Instructional Video
Click here for a quick video guide for using Lt. Planckster! This video provides the most basic instructions for how to use Kubeflow in the context of Kernel Planckster. It may be sufficient on its own, but can be combined with the documentation provided in this section for a deeper understanding of the data processing machinery that supports Case Studies in Websat.
Kubeflow
Kubeflow is a platform that makes it easier to house, test, automate, and monitor the machinery necessary for AI / Machine Learning based workflows. It's a kind of "command center" that allows you to orchestrate the code, data sources, and other resources you need to use.
Kubeflow is a Creative Commons project, whose components are based on the Open Source Kubernetes project. You can learn more about Kubeflow on their main website.
In the context of Kernel Planckster, Kubeflow's primary function is to manage the scraping Pipelines that feed materials into Research Contexts. In other words, Kubeflow receives data ("intelligence") and broad directives ("orders") from Kernel Planckster, and puts together all the pieces necessary to execute them - hence the name "Lieutenant Planckster". But Kubeflow can also be used to test and troubleshoot these Pipelines, interact ad hoc with the data as needed, and more.
UI Tips
All of the list pages described below have some useful searching and filtering options.
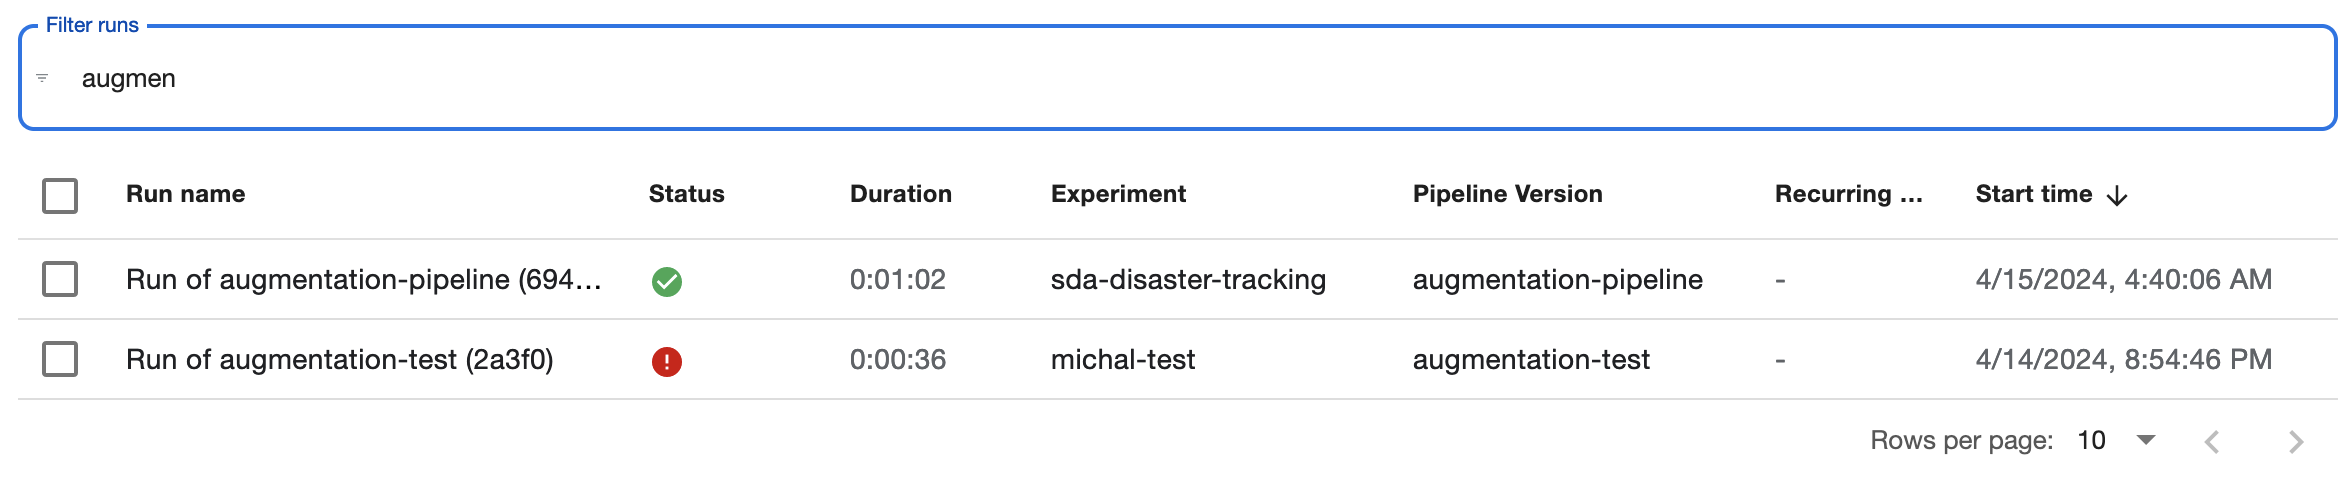
Filtering: List pages can be filtered by typing a search term into the Filter bar at the top. There are two types of filters, though.
- Static filters have no border, the prompt doesn't name the type of object being filtered, but provides options for filter category, and has a question mark tooltip at the far right with info on advanced options. To apply this sort of filter, it's necessary to submit (e.g. by pressing the return button) after typing the filter term.
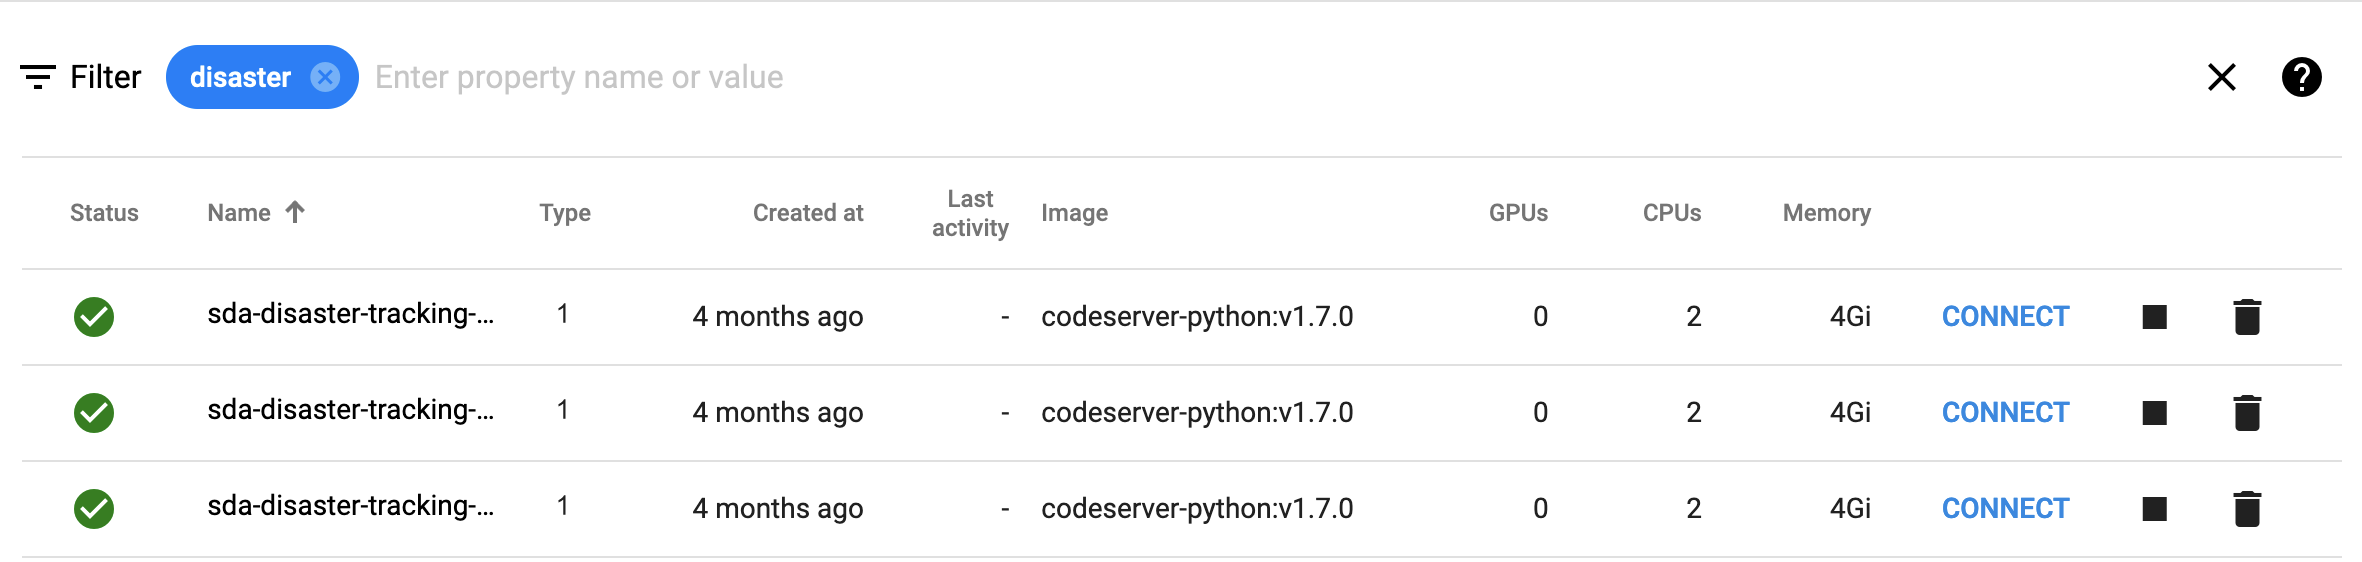
- Dynamic filters have a border, name the type of object being filtered (e.g. "filter runs"), but provide no other options and no tooltip. These filters begin applying as you type.
Pagination: By default, most list pages show 10 items per page. Pagination can be found at the bottom-right of the page, but it's subtle and can be easy to miss! The pagination allows you to move through pages, but also to change how many items show per page. 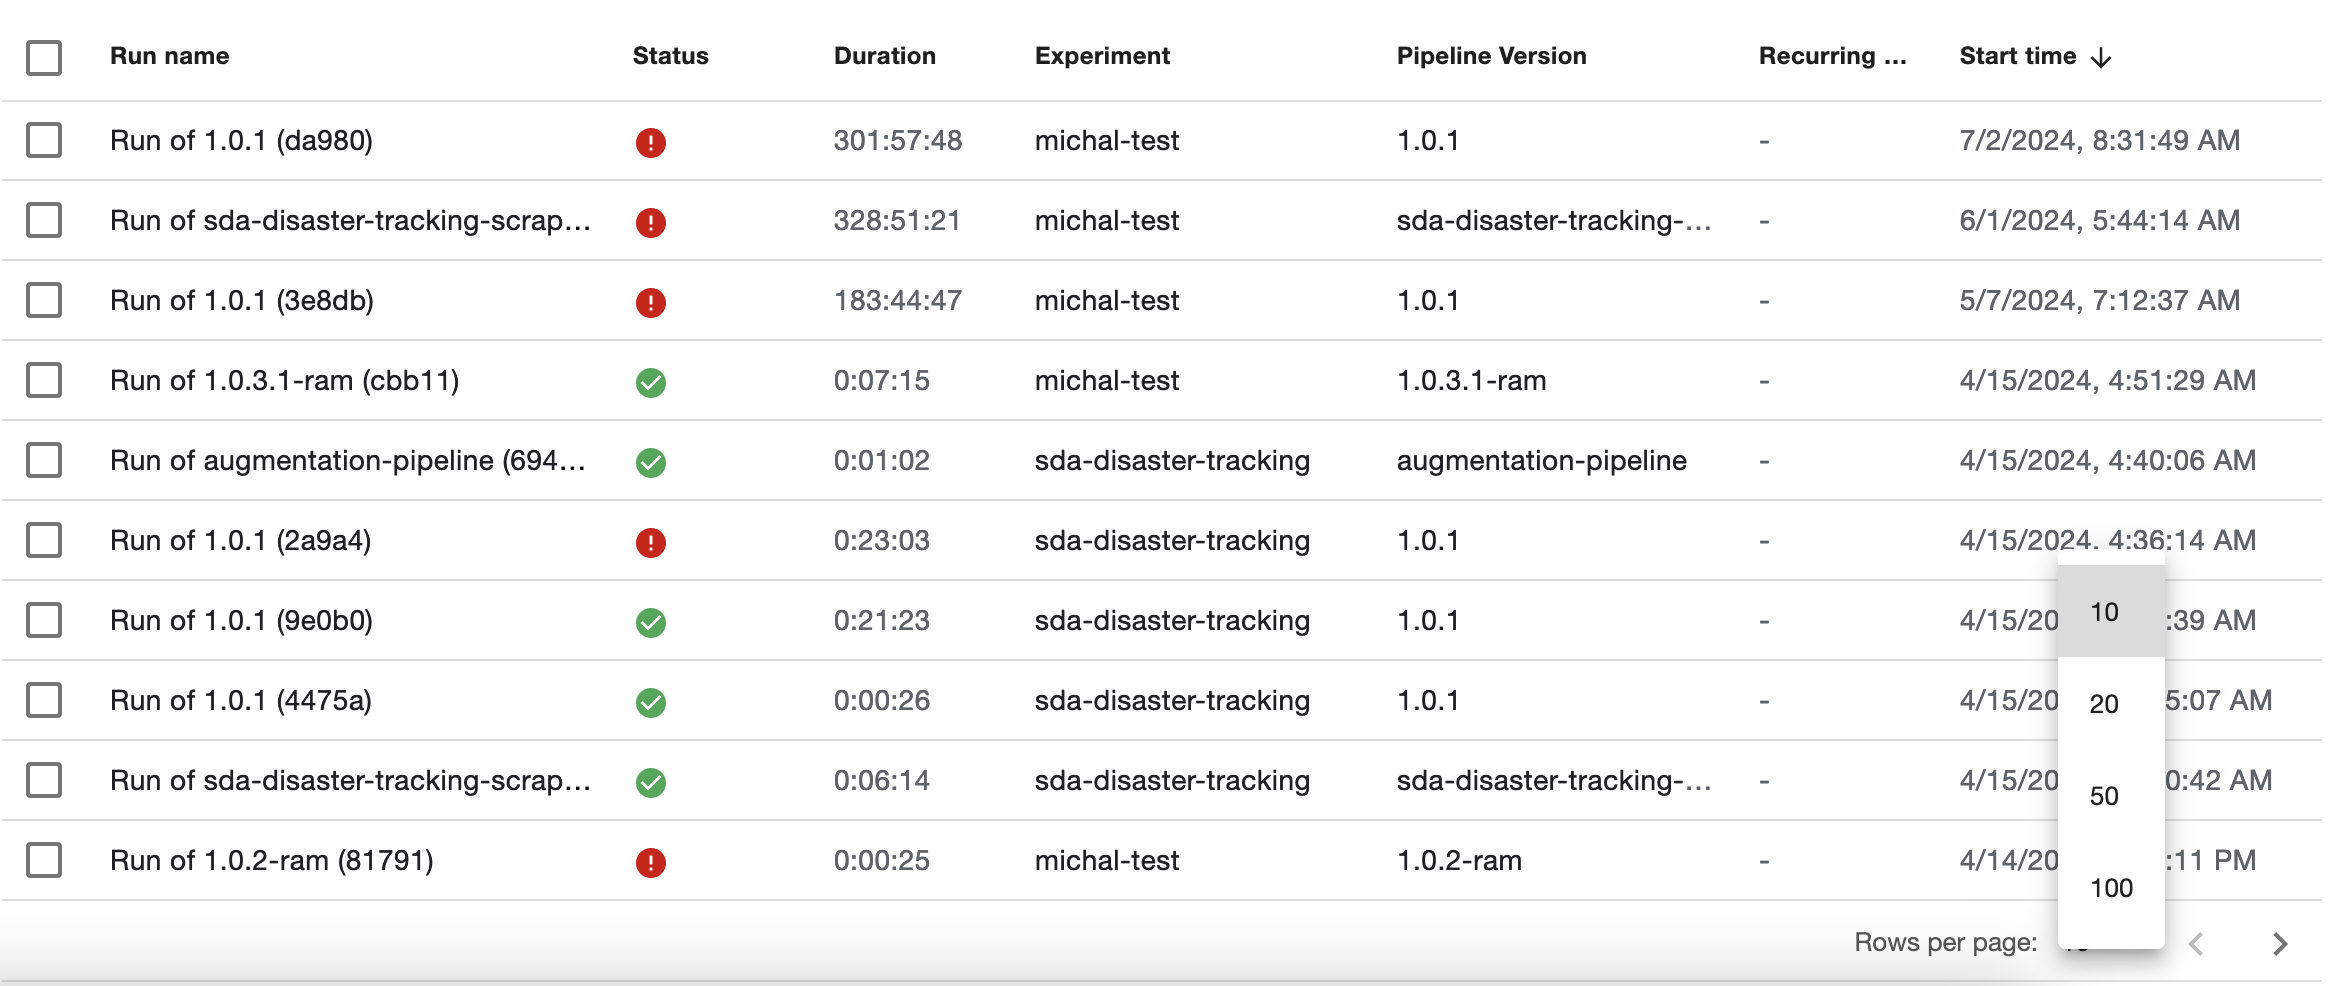
Notebooks
Notebooks are where you write ad hoc code to interact with all the remote resources that make up or are produced by the Pipelines you run on Kubeflow. You can use them to load environments and images, call code you have saved remotely, interact with data, files, or other resources that are the inputs or outputs to your workflows, and more. Each Notebook is actually a whole project on its own server, which can contain any number of files - including Jupyter Notebooks (.ipynb) - for you to interact with or output.
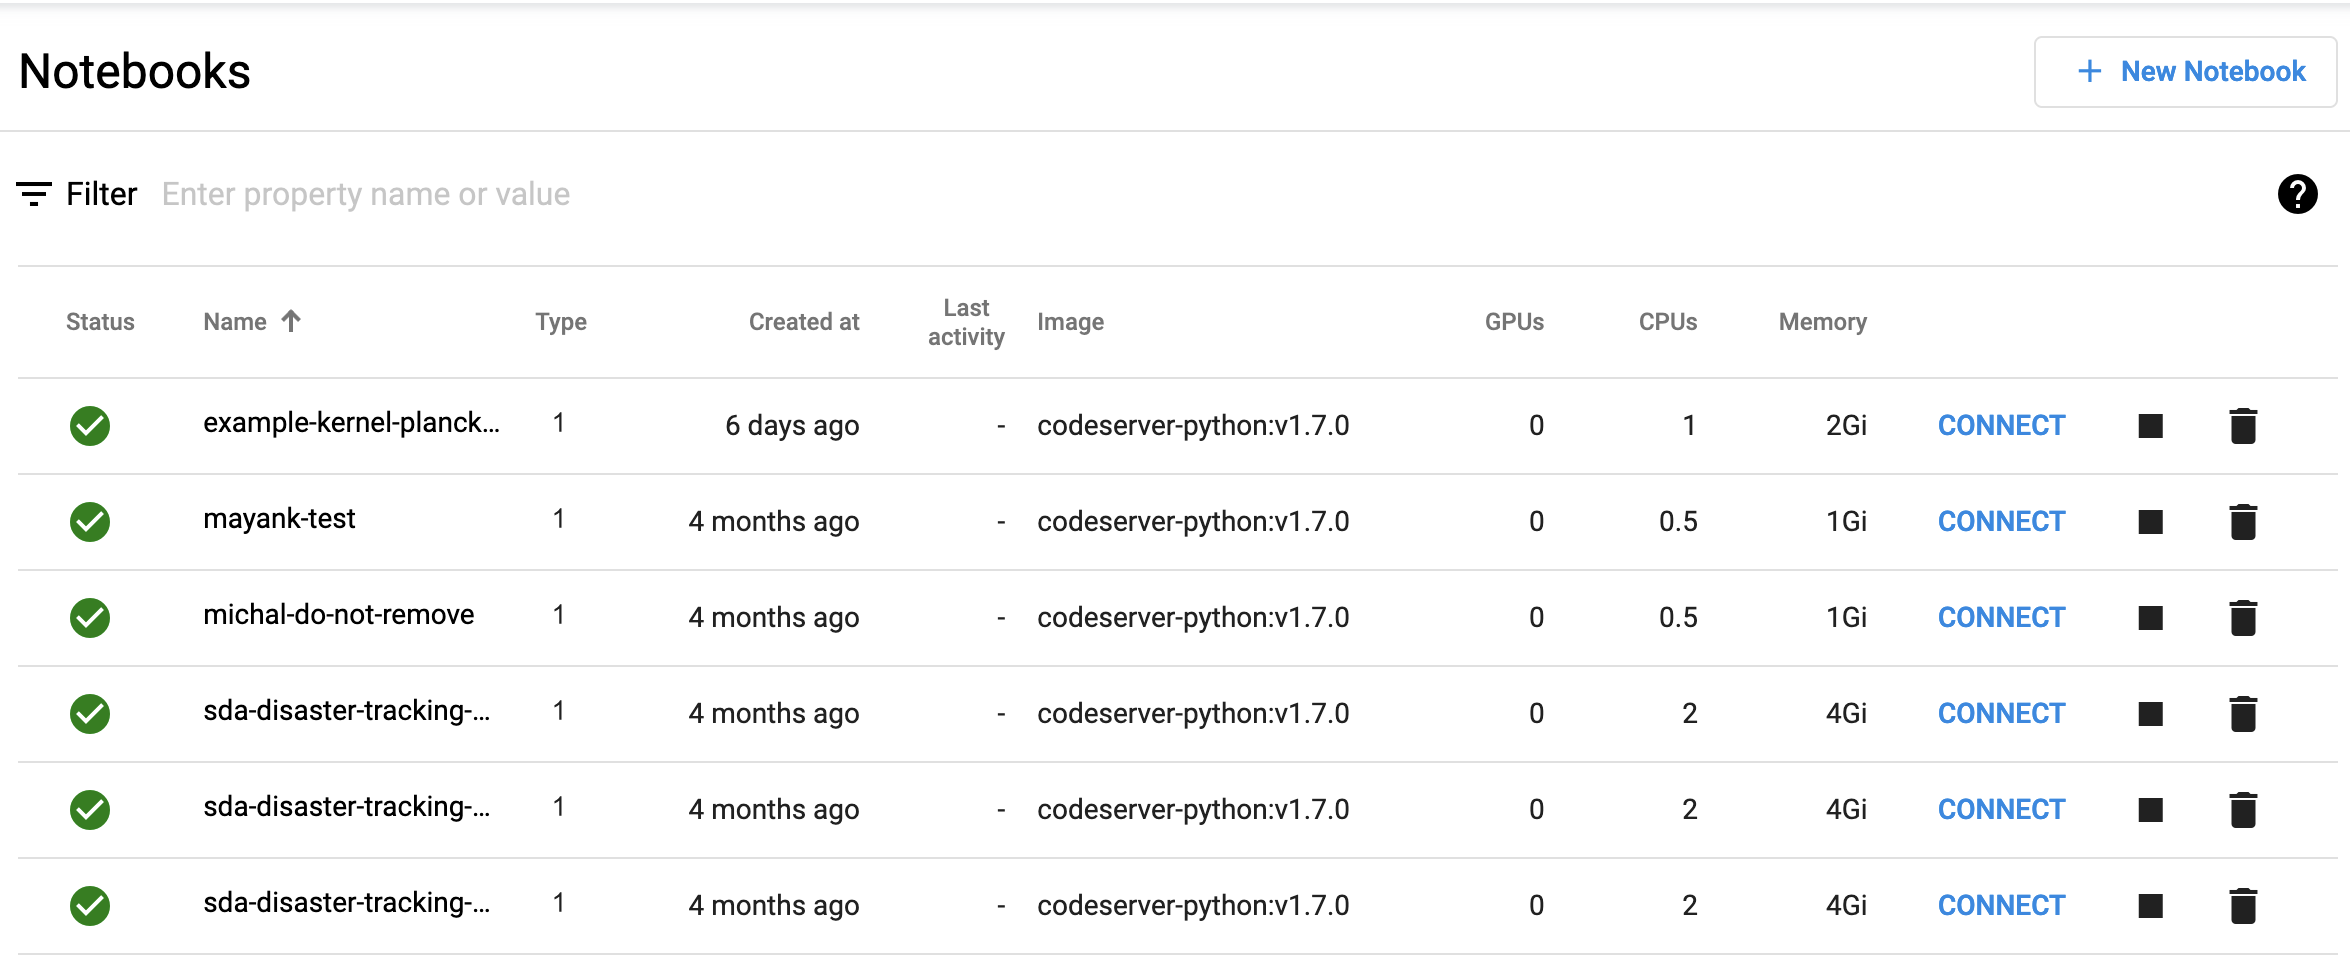
Notebooks List View
On the Notebooks page, you can see all of these projects listed.
Notebook Detail View
Clicking on one of the Pod Names shows details about its configuration, including applied Volumes, Environment, but also the resources allocated, as well as its history (condition, events, logs).
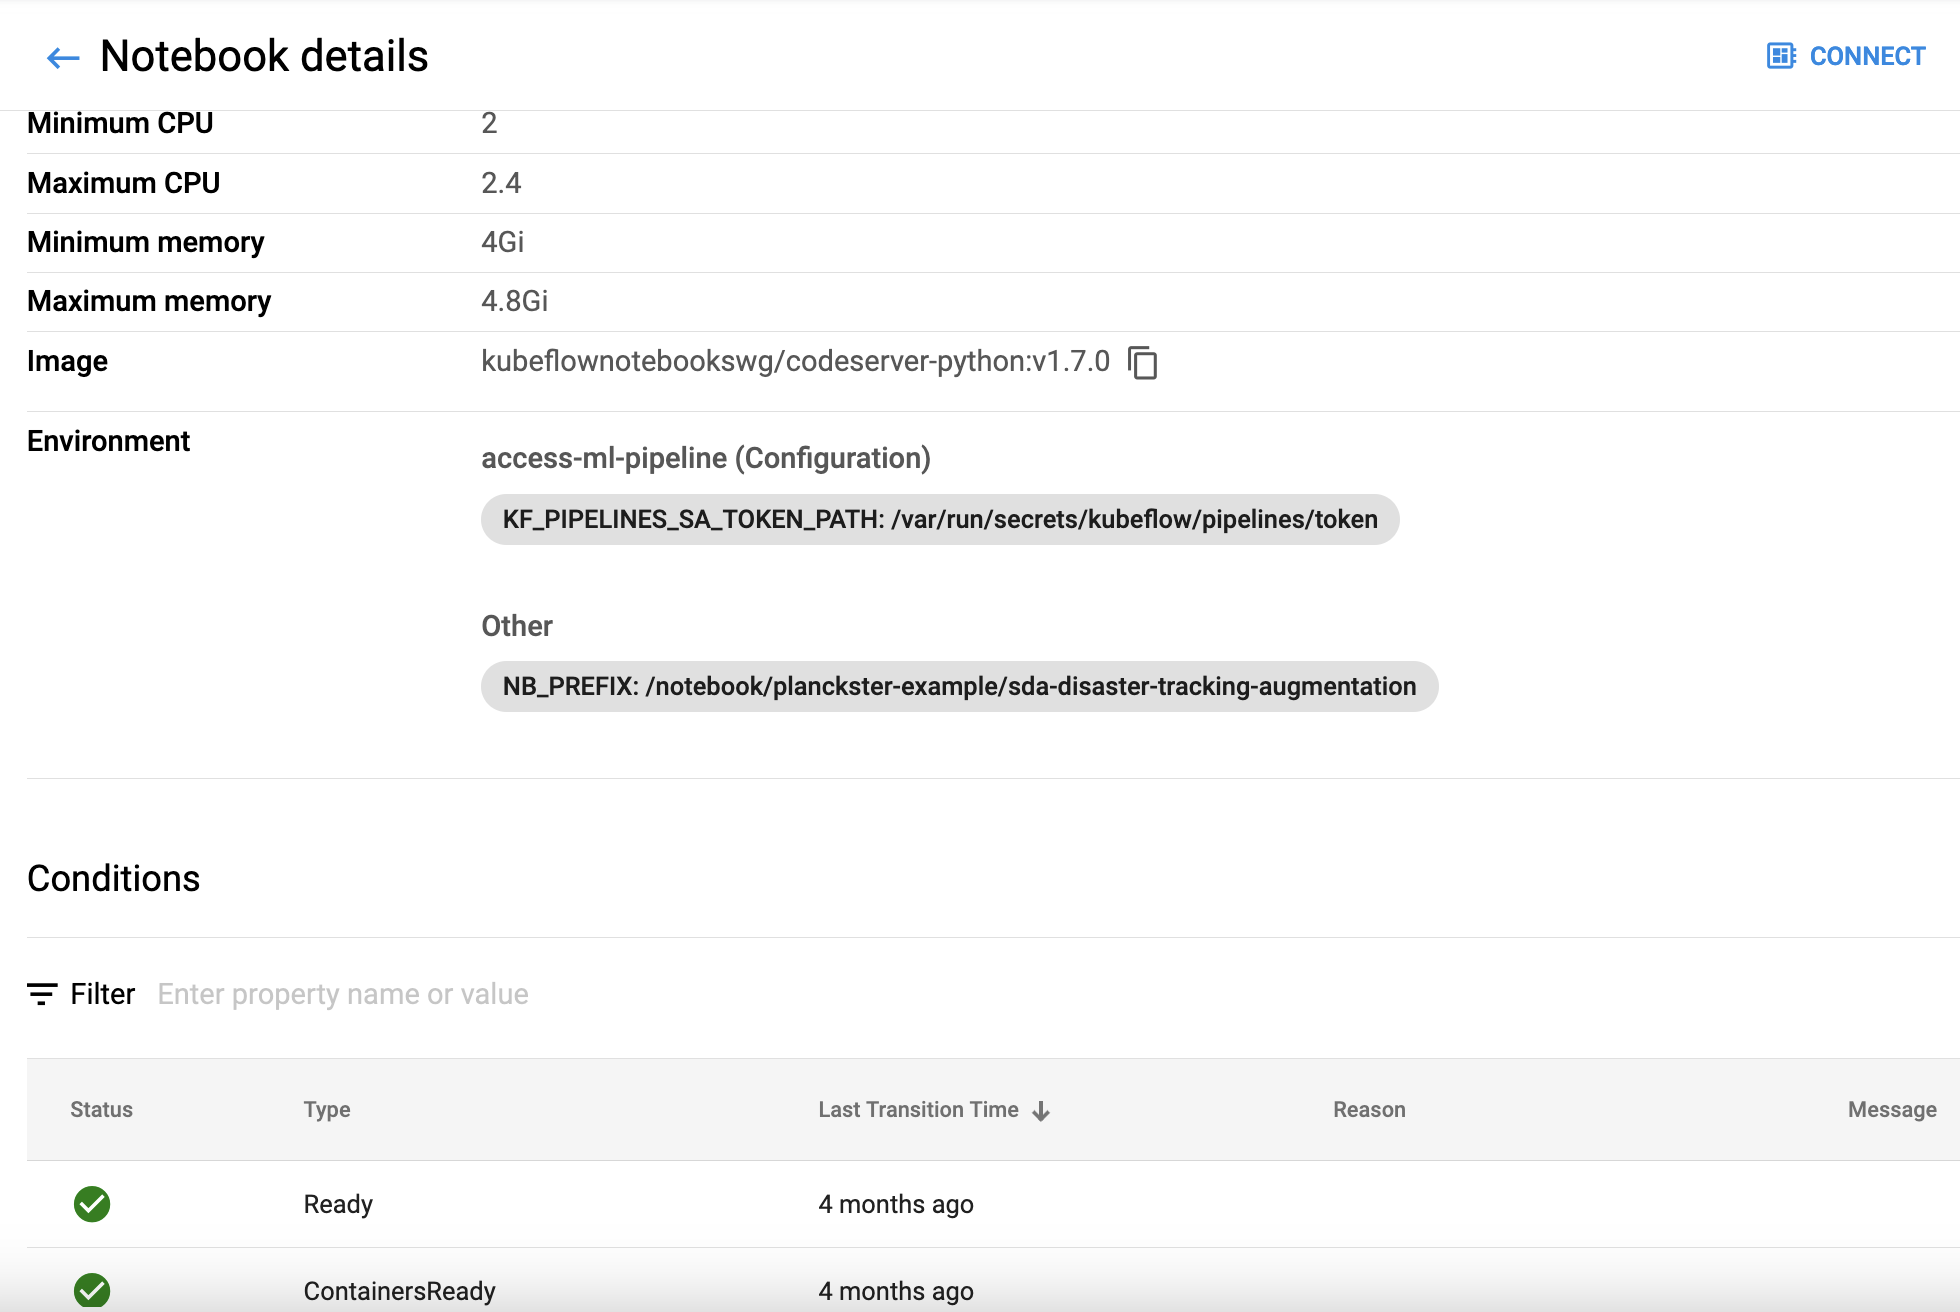
To interact with the files in one of these projects, click CONNECT, which is a button at the top of the detail view, or a link on each item towards the right of the list view.
Create New Notebook
You can create a new Notebook by clicking the New Notebook button on the list view. From there, you will need to name the Notebook project, choose the type, allocate resources, create a new Workspace Volume, and either create a new Data Volume, or assign an existing one.
Note: If the Notebook is to be used for creating Pipelines, you must explicitly "Allow access to Kubeflow Pipelines" in the configuration section's Advanced Options:

Pipelines
Pipelines are where all the different components - including code and images stored remotely, such as the three scrapers - are pulled together into a workflow. In Lieutenant Planckster, these Pipelines are configured using YAML files that are created within corresponding Notebooks.
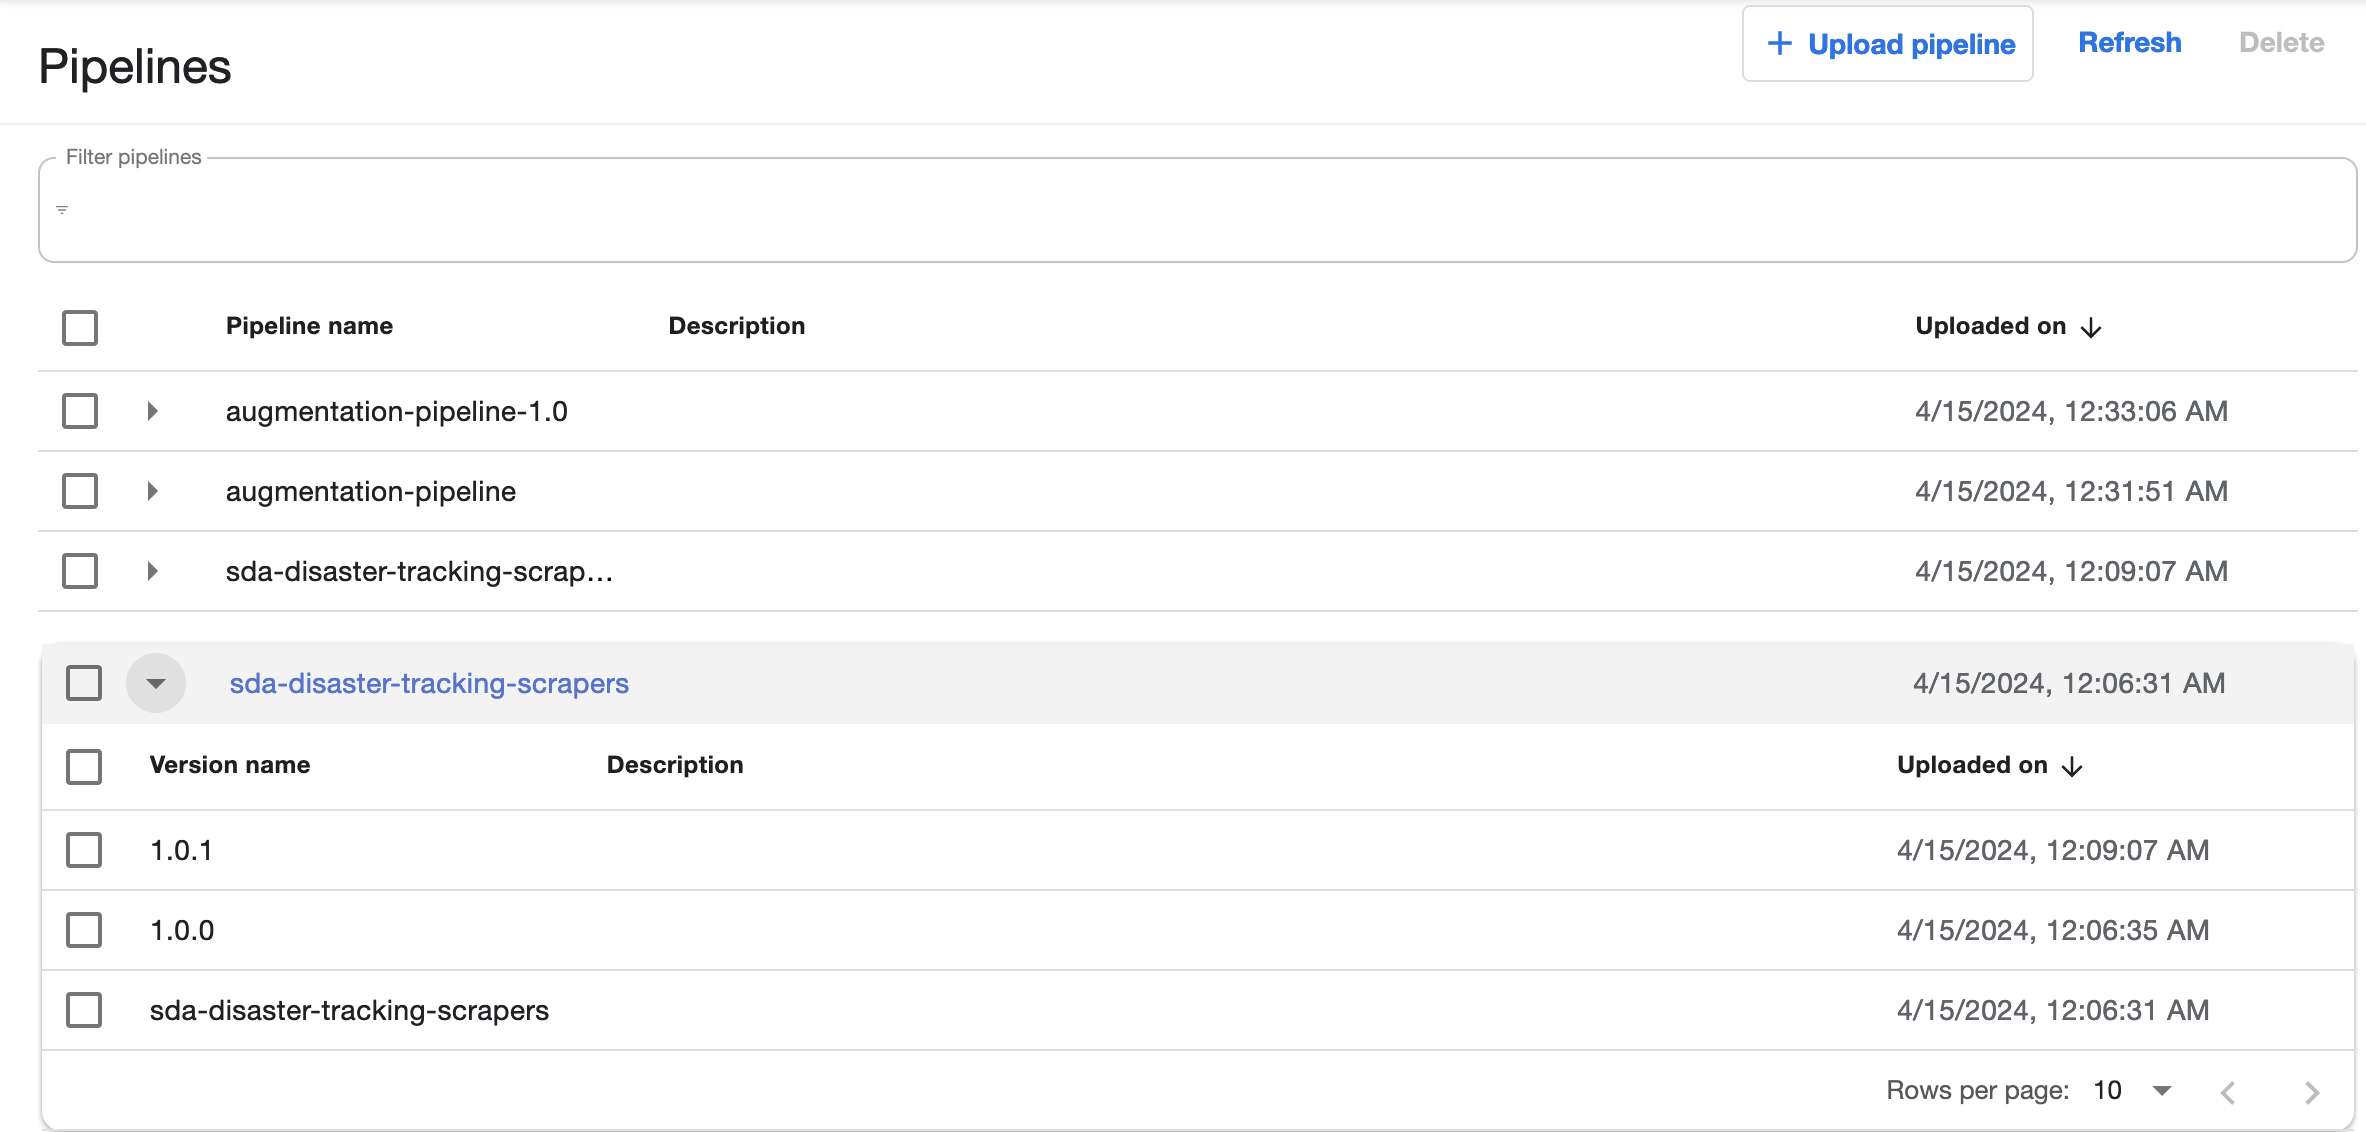
Pipelines List View
The Pipelines page shows a list of all the Pipelines that have been set up. You can click on the little triangle to the left of any of them to see the various versions that have been saved.
Pipeline Detail View
You can click on the name of any of the versions to see both graph and markup (YAML) representations of that Pipeline (clicking on the overall Pipeline name takes you to the current, most recent version). In sda-disaster-tracking-scrapers, for example, you can see that the structure of the Pipeline is relatively simple: all three scrapers run in parallel, with no need for any complicated conditional sequencing, or any data to be passed between the Pipeline's components. But all of these layers are possible should the need arise!
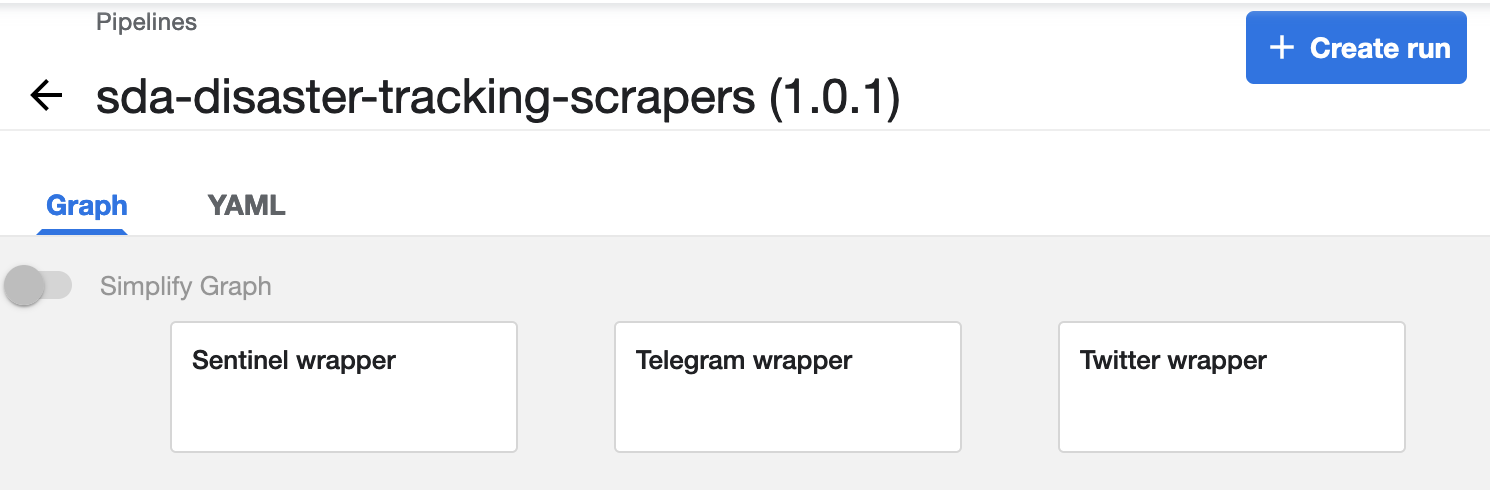
You can manually run your Pipeline by clicking the Create Run button at the top. Note that you will need to specify an Experiment the run is associated with.
Pipelines are set up to run via Experiments.
Experiments
Experiments in Kubeflow Pipelines are how Pipelines are run. In addition to production runs, they allow for test runs with controlled configurations and parameters. In the context of Lieutenant Planckster, Experiments are how the X (Twitter), Sentinel, and Telegram scrapers are regularly run in the background, without requiring any kind of manual trigger.
We can also use Experiments to troubleshoot Pipelines and ensure they perform as expected under various anticipated scenarios. Experiment Runs show details about the success or failure of the overall workflow, as well as individual components, so that Pipeline stability can be ensured before full deployment. Runs can be ad hoc or set up to be recurring.
Experiments List View
The Experiments page shows a list of all the Experiments that have been created. You can click on the little triangle to the left of any of them to see the performance of that Experiment's most recent runs.
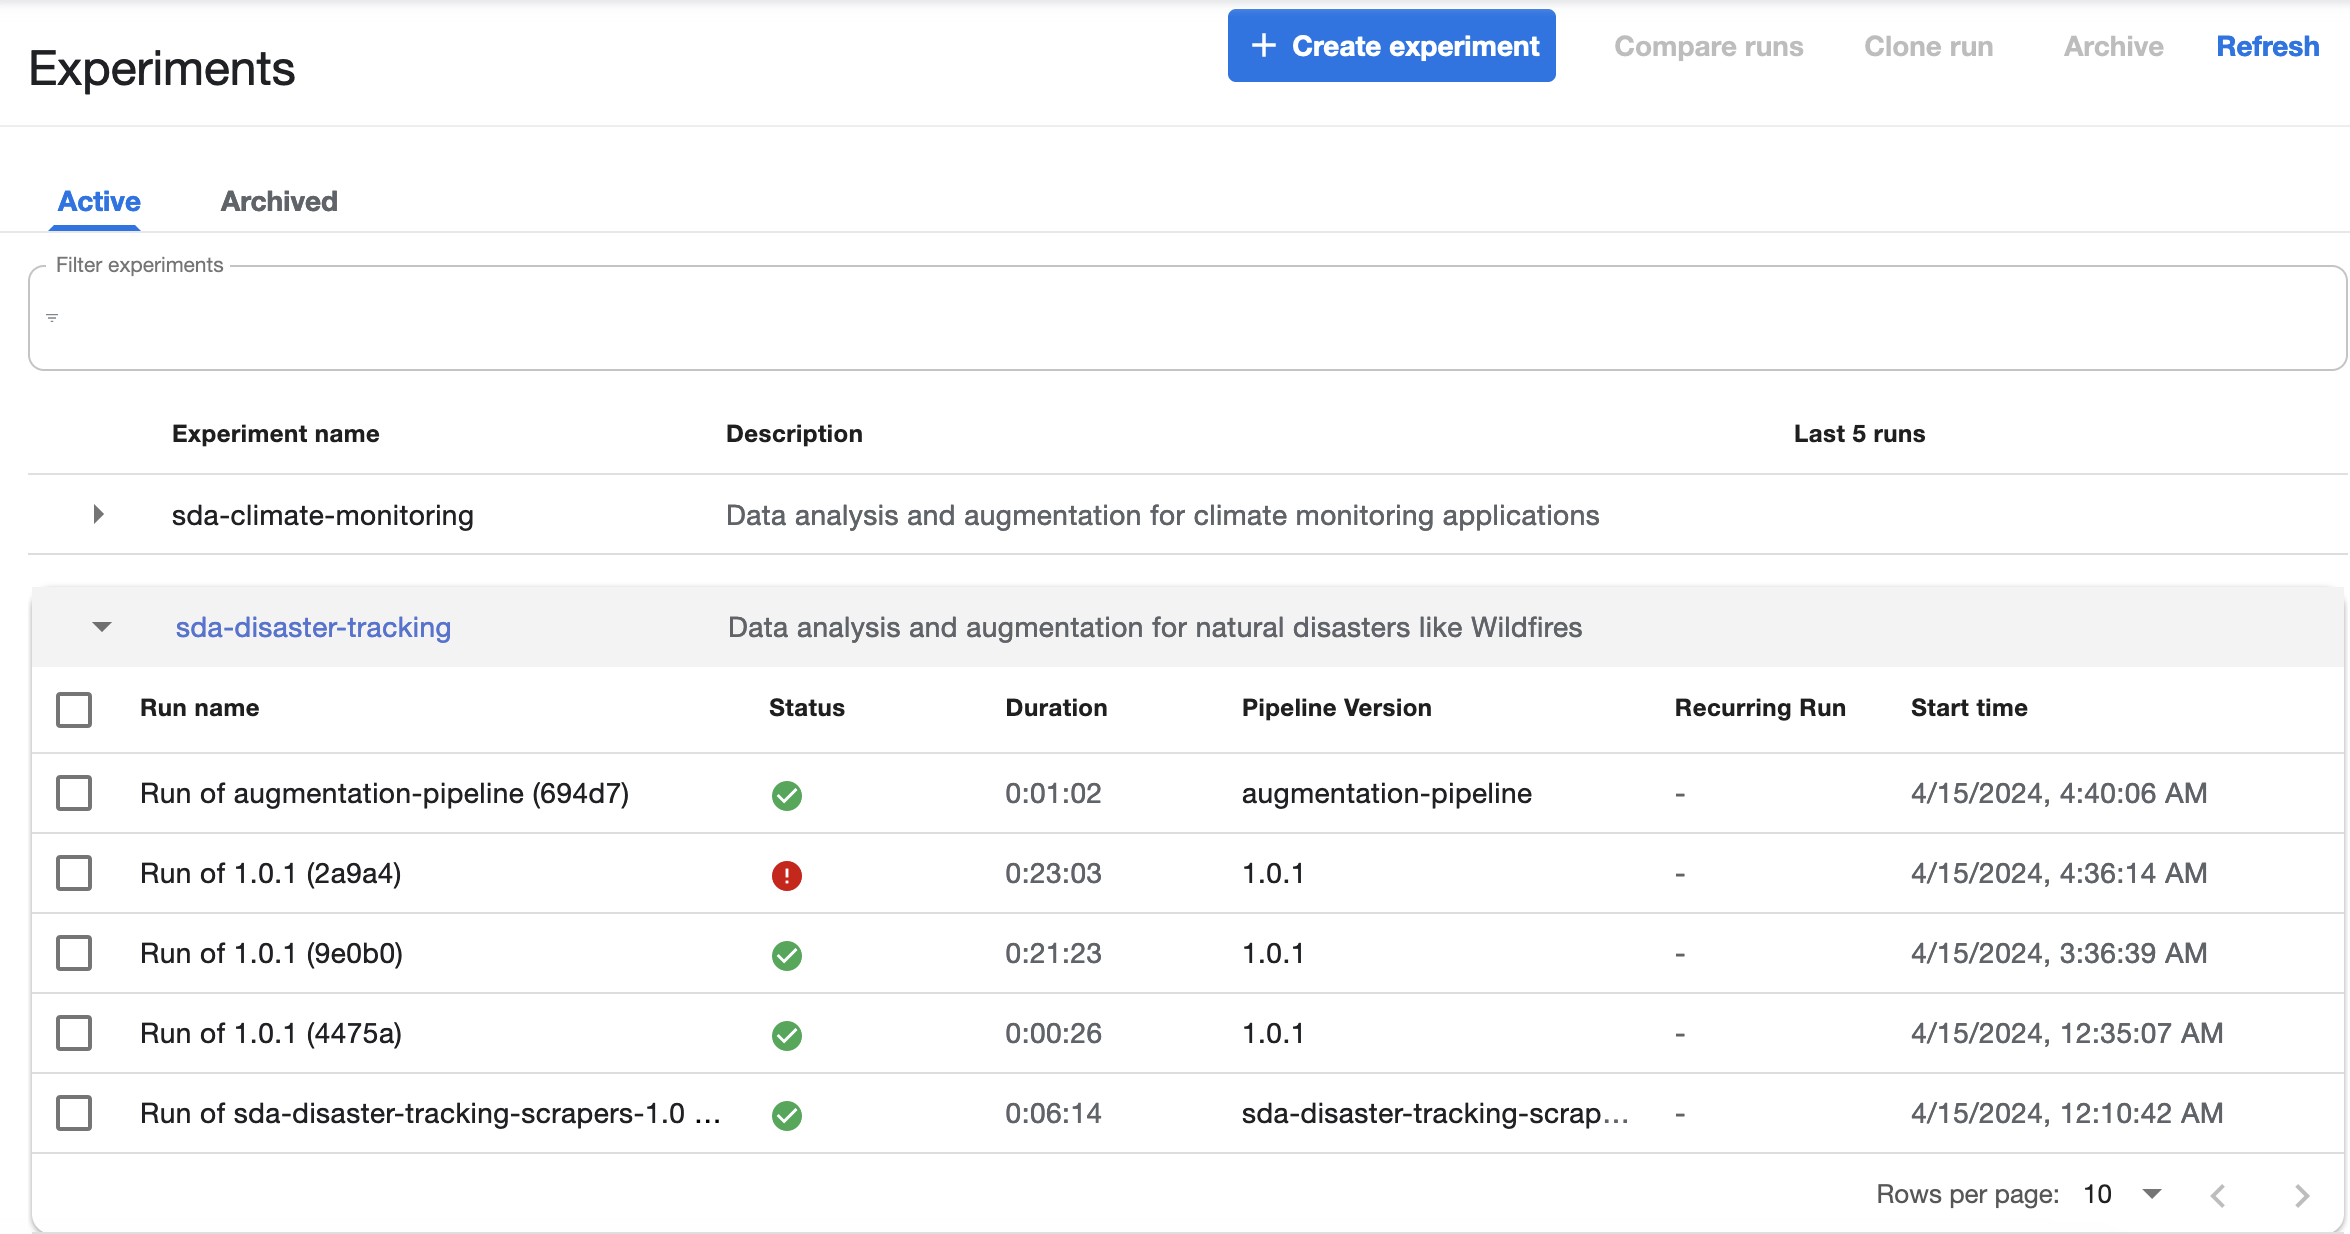
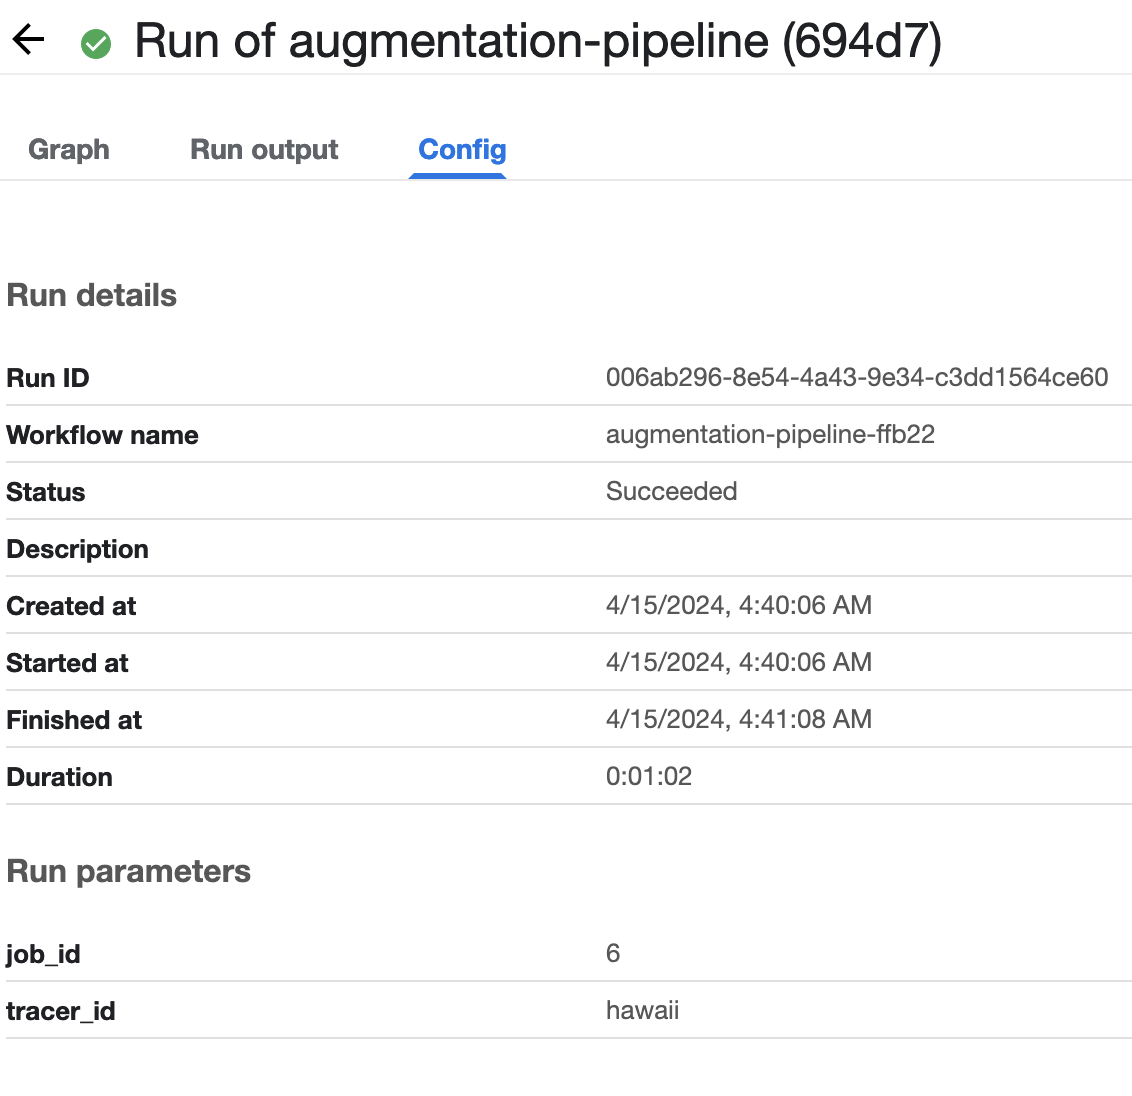
Clicking on the Run name takes you to the details of the run. The Config tab shows the parameters with which the Experiment was conducted.
Clicking on the Pipeline version takes you to the Pipeline Detail View.
The Experiment Detail View is effectively the same as what is revealed by clicking on the triangle next to an Experiment in the list view.